Steady as she goes?
No changes to holdings as of the close of markets Friday, Apr 21.
The markets have continued to do well in the face of record oil prices, skyrocketing commodity prices, huge gold and silver moves and rising bond yields. The biggest move this week came on the news that the FED might be close to ending their current interest rate rise (or at least pausing to assess). The markets took this as a positive but ironically during the past 70 years the DOW has been down an average of 12% following this first "pause" by the FED.
This coupled with the seasonal tendencies in the markets (May-Oct historically have tended to be the 6 worst months to be invested in the U.S. markets; I'll post data on this in a later post) have me currently looking to exit to cash soon. However, as much as my "gut" tells me we are close to a downturn, following the charts is still the best way to go.
Current Fund Prices
Fidelity Emirates Managed Equities Portfolio:$17.08 (20 Apr)
MLIM Emirates Managed Equities Portfolio:$15.90 (20 Apr)
I showed a PNF chart in a previous post. While there are various ways to chart the markets (line, candlestick, OHLC, etc), I like using PNF charts in addition to the others as they give me a good look at when support/resistance levels have been broken. They also eliminate the clutter associated with other types of charts.
For those who want to learn about PNF charts, here is a good link to some information:
http://stockcharts.com/support/pnfCharts.html
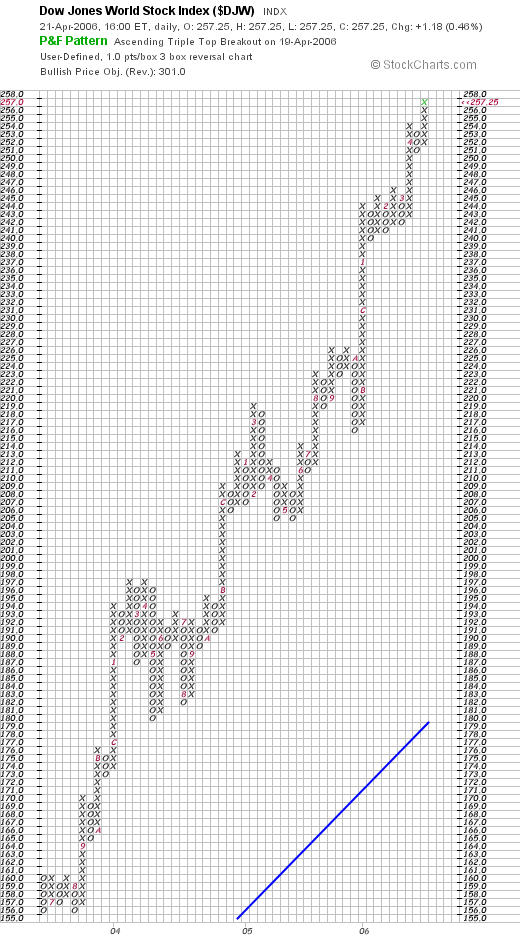
Unlike others, when the markets start to get "frothy"; ie. overbought as they are now, I like to use a user defined 1 box chart for the DJW index.
As it stands now, the chart is still on a buy signal from early Oct, 2005 when the DJW broke through 226. It is currently sitting at 257 for a 13.7% return. As can be seen at the top of the chart, using plotting of the chart pattern a top of 301 is the bullish price objective. Do not use this as the target; while it is technically possible it is used as only a guide as to how far the move could technically be expected to go. Sometimes it makes it but many times it does not; hence the reason you must follow the chart movements daily.
When to sell? As it currently stands, a sell signal would occur on a break below 251. It is possible it could break below and then rebound back up again. This is the problem with a narrowly defined chart such as a 1 box, the chance there could be some "whipsaw" action where it goes from sell to buy to sell. BUT given the seasonal tendencies and the strong move that has occured to date, I think it would be prudent to take at least 50% profits (into cash) at that time and maybe wait and see. Or I might go right to 100% cash, it all depends on the structure of the charts at that time.
Current PNF chart (1 box user defined)
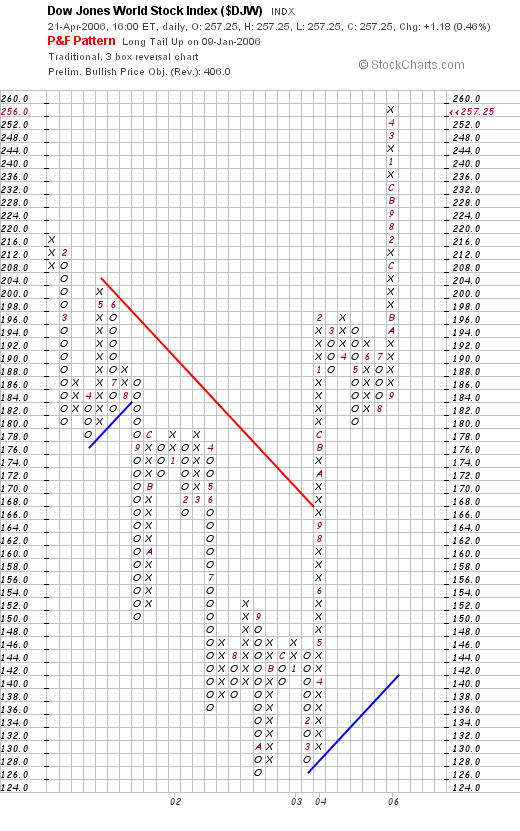
As can be seen in the traditional chart, theoretically the market could fall straight through 182 before generating a sell signal. However, chances are this will not happen. What will probably occur is a 3 box reversal (going from X to O) in the new column; then some mild up and down around the 230-240 area before a definate sell signal on the traditional chart. Once again, I might be 50% cash and wait for this confirmation or I might be 100% cash when this occurs depending on the structure of the charts.
Current PNF chart (Traditional)
posted by Emirates Capital Asset Management @ 2:08 PM
0 Comments
![]()
![]()

0 Comments:
Post a Comment
Subscribe to Post Comments [Atom]
<< Home