Stock market update 27 August 2011
Another week of "wait and see" on the markets. Large daily price swings continue to dominate the equity markets with little decided in the "big picture".
As it is near the end of the month my monthly charts become valid. As such, I will start with a top-down review in this post.
Click on all charts to enlarge:
SPX monthly charts:
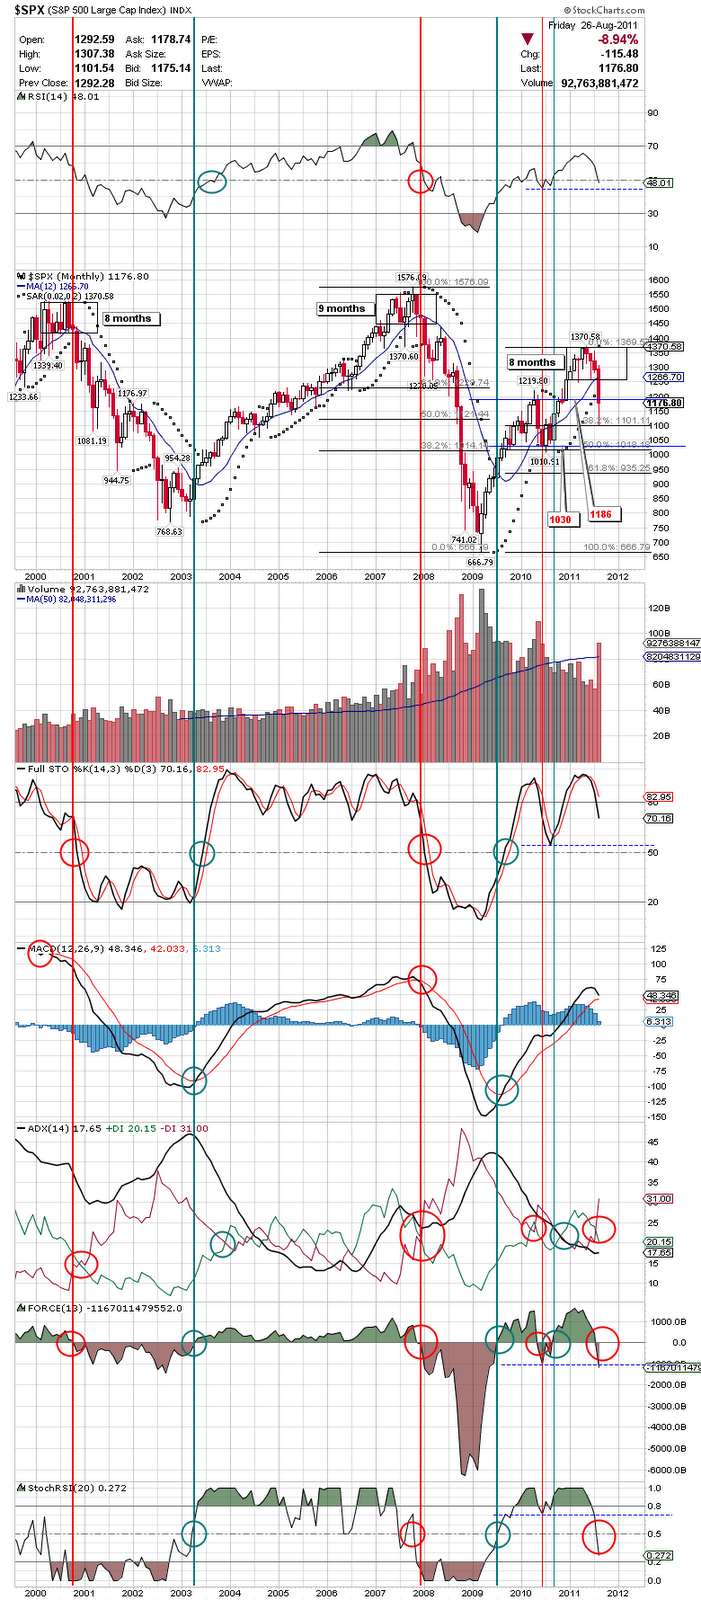 |
| SPX 10 year monthly |
The first chart is the standard monthly chart of the SPX.
Unless there is a miraculous recovery in the next few days (a close > 1266.70) it must be assumed the SPX will close the month of August below it's 12 month simple moving average.
As subscribers know, the monthly and weekly charts are the two I use to determine equity asset allocation. When both are in bullish agreement, I am normally fully invested. When one is bullish/one bearish I am normally in a 50% equity/50% cash position. When both are bearish I am normally in a 100% cash position.
Once again, a close below the 12 mSMA does not unto itself justify a bearish ranking. There must be technical indicators to corroborate the price indications to avoid unnecessary whipsaws in the signals.
As can be seen on the chart, currently there are 6 indicators bearish:
-RSI < 50 (but not yet below the May, 2010 head-fake)
-SAR
-12 month SMA (but not yet below the May open @ 1186)
-ADX
-Force (but not yet below the May, 2010 head-fake)
-Stoch-RSI
Also there are still 2 indicators bullish:
-Full Stochastic >50
-MACD yet to cross over
I am currently leaning heavily bearish currently but those 2 bullish indicators (and 2 bearish indicators still above the May, 2010 lows) still bother me. As such, I will give the market a few more days for the market to show it's hand (more on that strategy in my next blog post).
 |
| SPX monthly 2 year |
A monthly close on the SPX for August below 1180 would be another good confirmation we have entered a bear market. We closed Friday @ 1176.80 with 3 more trading days to go in August.
As of Friday, 26 August 2011 I remain in a strategic 50% equities/50% USD cash weighting as follows:**
-BlackRock US Dollar Cash Portfolio Fund: 50%
-Russell Global 90 Fund: 15%
-Fidelity International Fund: 10%
-BlackRock Equity Portfolio Fund: 25%
**Actual positions will change daily based upon price action and market volatility.
Legal Disclaimer: The content on this site is provided without any warranty, express or implied. All opinions expressed on this site are those of the author and may contain errors or omissions. NO MATERIAL HERE CONSTITUTES "INVESTMENT ADVICE" NOR IS IT A RECOMMENDATION TO BUY OR SELL ANY FINANCIAL INSTRUMENT, INCLUDING BUT NOT LIMITED TO STOCKS, OPTIONS, BONDS OR FUTURES. The author will reveal his current market positions and holdings but actions you undertake as a consequence of any analysis, opinion or advertisement on this site are your sole responsibility. The author is not licensed as an investment advisor in the UAE and therefore cannot provide individual account advice to individuals and/or institutions.
For further information please use the following email address and I will do my best to get back to you when able.
SPX weekly chart:
 |
| SPX weekly chart |
For the week the SPX closed up 4.74%.
The weekly chart remains bearish from late July with all technical indicators remaining bearish.
Price continues to hold the weekly support shown on the chart @ 1120. A break below 1120 and the 38.2% Fib @ 1101.73 and the next target low will be the support and 50% Fib collocated @ 1019.
SPX daily chart:
 |
| SPX daily chart |
The daily chart remains bearish with all technical indictors in agreement.
Bullish positive divergence on the RSI and Force indicates the strong bearish push we experienced the past few weeks has ended and we are in a position to advance upwards from this point.
I have drawn a consolidation box clearly showing our back and forth price action the past 15 trading sessions (3 weeks) between 1120-1208. We have gone no where since my "Wait" blog 12 August. Those who panic-sold at those levels are wondering today whether that was the right move. It was not.
Another day of positive price action on Monday would turn the daily chart bullish. Price needs to break above the upper boundary of the box in order to set up a "higher low/higher high" price trend. Until then, we remain range bound between 1120-1208.
SPX 60 minute charts:
 |
| SPX 60 minute chart |
The 60 minute chart turned bullish several days ago.
It appears to be forming a symmetrical triangle pattern. A break below the pattern would be exceptionally bearish with a target 130 points below the breakdown point (approximately 1010). Alternately, a break above would target an additional 130 point to the upside. Since the pattern was entered from above, 2/3 of the time the exit will be in the same direction as the trend (i.e. down)
This pattern needs to be watched closely in the next few days.
 |
| SPX 60 minute |
A close up view of the 60 minute shows a possible rising channel leading out of the upper trend line of the triangle mentioned previous. This would be encouraging and a break above 1208 would be really bullish.
Not there yet!
Key indicators to watch the next few weeks
Many traders/investors center their attention on the equity charts without considering the other investment vehicles which sometimes give clues as to the future direction of stocks.
Here are a few I am monitoring:
U.S. Dollar:
 |
| US Dollar |
The USD has been in an extraordinarily tight price range since early May 2011 between 73.50 and 76.00 (shown by the consolidation box).
Price remains below the 50 day moving average and the associated technical indicators remain bearish. As such, there is a reasonable likelihood price will eventually break below the bottom of the box. This would be bullish for equities given their current inverse correlation to the USD.
Alternately, should price miraculously break above the upper resistance line of the box, this would be very bearish for equities. Watch the box for clues:
-USD < 73.50 = bullish for stocks,
-USD > 76.00 = bearish for stocks
Gold:
 |
| Gold daily chart |
A lot of hedge fund hot money has gone into gold over the past 6 months. Should gold break down those funds will flee to other asset classes (such as stocks). As such, gold needs to be monitored for clues.
Price was WAY OVERBOUGHT on gold the past few weeks (as shown on the chart). In fact, late last week I had a naive young Thai cabin crew member tell me she was buying more gold as she explained to me that "GOLD NEVER GOES DOWN". It was at that point I highly recommended she sell her gold positions. She looked at me like I'd come from another planet.
Subsequently we had the huge fall in gold this week. Tuesday/Wednesday saw a loss of over $200/oz before a recovery on Thursday/Friday. Looks like the crazy price swings in the equity markets are now moving over to the gold markets.
Technically the price chart on gold remains bullish. Price dramatically broke but held support lows at the 50% Fib @ 1698.46 (low last week was 1705.40).
In spite of the drop, all the technical indicators on the daily chart remained bullish. Excellent closing price support was found at the intersection of the 38.2% Fib, the up trend line and the support level @ 1750. This was a very good entry point for my gold-loving cabin crew; hope she jumped on it!
Price needs to hold above the trend line/1750 price level. A daily break below and the next support is not until approximately 1650-1660.
A break below 1750 and I suspect hot money will flood out of the gold market; I suspect a good portion of that hot money will flow into the equity markets. Alternately, continued bullish price action in gold will act as an alternate to equities.
U.S. Government Bonds:
 |
| 10 Year US Treasuy |
A good place to look for clues as to where the equity markets are going is found in the bond market.
Money has been flocking to US bonds (in spite of the AAA downgrade) as a safe haven from equities. If we should see money leaving bonds, there is a very good chance most of it will go back into equities.
Last week the 10 year US Bond hit $130.07; a price level not seen since the stock market meltdown lows back in 2009. Since then price has formed it's own consolidation box as shown.
A break below 128.46 and money should start to flow out of bonds and back to stocks.
 |
| US 10 year yield |
A close up look at the yield on the 10 year treasury provides some interesting clues.
As noted on the bond price, the yield has entered a consolidation box. The low last Thursday @ 1.978% was the lowest yield EVER on the US 10 year (below the 2008/2009 meltdown).
It is interesting to note yield made a "lower low" by breaking below the close on Aug 10 (shown by the red horizontal line) followed by a jump back above the line on Aug 23. This is a classic technical "double bottom" that needs to be confirmed by a closing yield above the closing high set Aug 11 @ 2.336. A daily close above there would be very bearish for bond prices and conversely very bullish for equity prices. Alternately a yield break below Aug 19 (bottom of the box) would be very bullish for bonds/very bearish for stocks.
Bottom Line:
In summary, overall the monthly and weekly charts are bearish. The daily chart is bearish (but on the verge of a possible bullish signal) and the 60 minute chart is bullish. Thus the picture is one where we are long term bearish but in a short term bullish correction phase.
As such, I plan on holding my Provident Fund at the current 50% equity/50% cash position as it appears the short term charts will allow me an opportunity to sell my 50% equity position at a higher price level than current.
This in no way changes my long term outlook in that I believe we are on the verge of entering a multi-month bear market (assuming all my monthly technical indicators come into alignment).
Emirates Provident Fund:
As of Friday, 26 August 2011 I remain in a strategic 50% equities/50% USD cash weighting as follows:**
-BlackRock US Dollar Cash Portfolio Fund: 50%
-Russell Global 90 Fund: 15%
-Fidelity International Fund: 10%
-BlackRock Equity Portfolio Fund: 25%
**Actual positions will change daily based upon price action and market volatility.
Legal Disclaimer: The content on this site is provided without any warranty, express or implied. All opinions expressed on this site are those of the author and may contain errors or omissions. NO MATERIAL HERE CONSTITUTES "INVESTMENT ADVICE" NOR IS IT A RECOMMENDATION TO BUY OR SELL ANY FINANCIAL INSTRUMENT, INCLUDING BUT NOT LIMITED TO STOCKS, OPTIONS, BONDS OR FUTURES. The author will reveal his current market positions and holdings but actions you undertake as a consequence of any analysis, opinion or advertisement on this site are your sole responsibility. The author is not licensed as an investment advisor in the UAE and therefore cannot provide individual account advice to individuals and/or institutions.
For further information please use the following email address and I will do my best to get back to you when able.
posted by Emirates Capital Asset Management @ 1:47 PM
0 Comments
![]()
![]()

0 Comments:
Post a Comment
Subscribe to Post Comments [Atom]
<< Home