Confirmed Sell Signal
Fidelity Emirates Managed Equities Portfolio-16.61 (18 May close)
MLIM Emirates Managed Equities Portfolio-15.46 (18 May close)
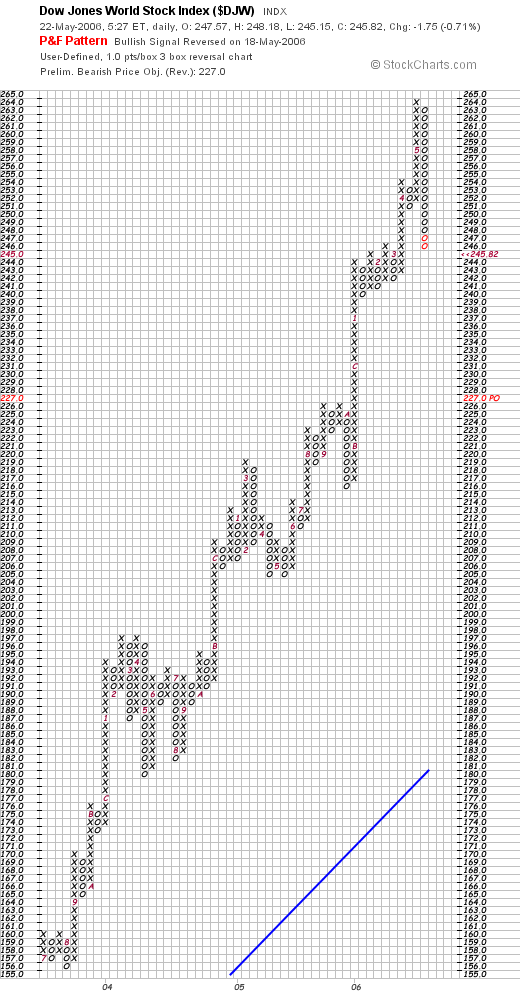
The daily PNF chart I use gave a confirmed sell signal on May 18 when the price broke through 251 (click on chart to view and expand).
I switched to 1/2 equities and 1/2 cash as per my post on May 17.
I have yet to switch entirely to cash at this time as the markets are very oversold at this point and a bounce can reasonably be expected. If you look at the PNF chart you can see a fair amount of previous price action in the 241-244 area (which was a previous level of resistance which was broken to the upside). This now serves as a possible area of support so I am going to be patient over the next day or two and see if this level holds.
If the DJW closes below 241 I will be exiting to 100% cash as it would indicate the possibility of a much more severe correction (possibly down to the 196 level which is a good area of support on the traditional PNF or 181 which is the blue trendline support on the 1 box chart) .
The other possibility is this might reverse and give us a buy signal as it did back in Oct/2005 when it broke 223 (sell signal), got down to 216, reversed and broke 226 (buy signal). The difference this time is Oct is usually a good bottom in the market (see previous post on seasonality) but now we are in May and seasonally May-Oct is the weakest time in the markets. As such, I'm giving this a low probability of occurring and hence my more defensive stance.
posted by Emirates Capital Asset Management @ 1:44 PM
0 Comments
![]()
![]()

0 Comments:
Post a Comment
Subscribe to Post Comments [Atom]
<< Home