Stock Update 25 January 2007
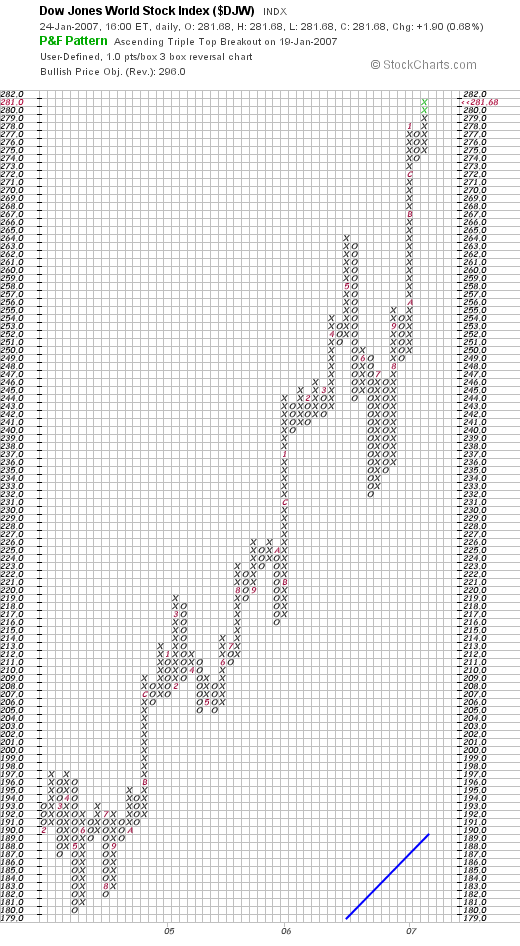
The Dow Jones World index PNF chart issued a secondary buy signal on Friday, Jan 19 on a close above 278.
Here is the same index in a line chart. Note the break of the uptrend line and fall in the 1st 2 weeks of 2007 and the sudden recovery to new highs. This is bullish behavior.
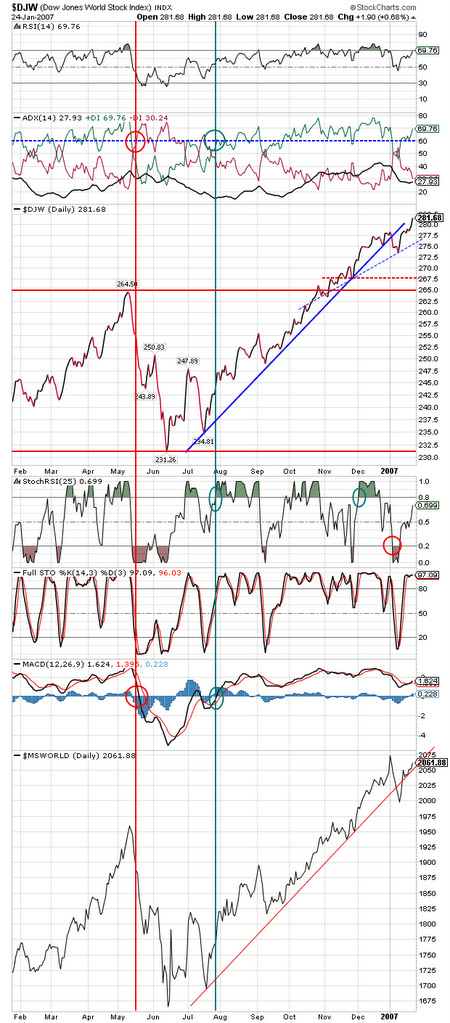
While I HATE entering a long position when the market is so over-extended (and while there are tons of reasons to not like this market), the bottom line is the chart does not lie.
To review, a sell signal was issued in May when it broke through 251. It was expected by most technicians (inc. myself) that it would continue to fall through the summer/fall period (based upon cycle analysis) and bottom around the end of Oct. This did not happen and in hindsight the chart was right on. It was right on it's first buy signal in August when the price closed up through 247 and it was right on it's first secondary buy signal in late September when it broke through 255. It has now issued another buy signal through 278.
I think what is happening is that the world is awash in liquidity and most of this money is finding it's way into the worlds stock markets. Central banks are printing money like there is no tomorrow and it is this liquidity that is floating the worlds markets. It is strange (in fact unprecedented) times right now in the markets and some of the old "rules" just are not working (seasonal tendencies, 4 year presidential cycle lows, etc) due to this liquidity.
Bottom line is I have switched my funds to a 50% equity position as of January 22. It is interesting to note the chart projects based upon it's structure a bullish price objective of 296 (note the rising wedge on the 3 years weekly chart from the 2003 lows and the top of the channel; same value of 296 as on the PNF chart).
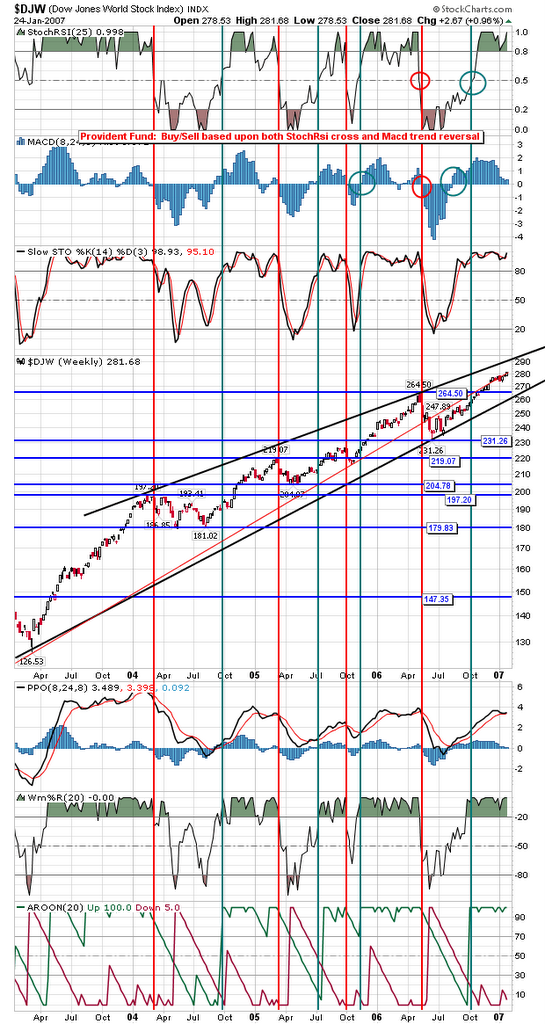
Note these projections are normally not that accurate (sometimes they fall short; some times they surpass the value) but it does give us a beginning target.
I will watch closely and if this market breaks 274 and issues a sell signal on the PNF chart I will bail out back to cash. This leaves me in what I would consider a relatively low risk position (50% invested) with a tight stop. Should the chart not break 274 and in the weeks ahead issues additional buy signals, I plan on scaling out of cash and into additional equity positions. Will advise if/when this happens.
posted by Emirates Capital Asset Management @ 10:43 AM
0 Comments
![]()
![]()

0 Comments:
Post a Comment
Subscribe to Post Comments [Atom]
<< Home