U.S. Dollar Update 21 February 2007
"Top Down" view of the U.S. Dollar (click chart to enlarge).
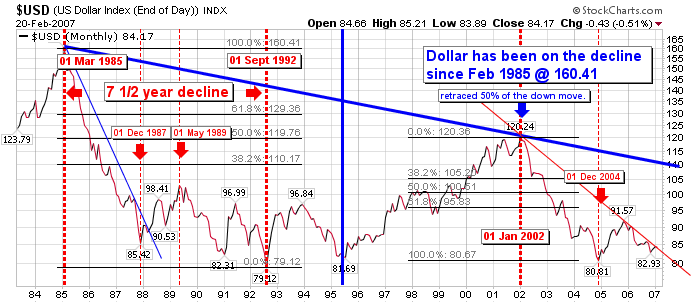
First is the long range view with a 20 year monthly chart. No surprises here and it is very easy to see which direction it is going (DOWN).
Very interesting to note the decline that occurred from 1985-1988 resulted in 1 swift move down(3 years) followed by 3 attempted recoveries (each with lower highs and lower lows) that stayed in a fairly narrow trading range over the next 8 years (1988-1995). Also note the "recovery" when it finally occurred retraced only 50% of the down move (this is known as a Fibonacci retracement level).
Assuming history repeats itself, is it possible the USD has done it's 3 year swift down move once again (2002-2004). If so it is possible we will see 3 attempts at recovery (each with lower highs and lower lows) and not see a recovery of any sort until 2012 (8 years)! Also when this "recovery" occurs, it is possible it will not achieve any more than the last recovery (50% of the retracement) which is 100.51. Not a compelling story for the USD.
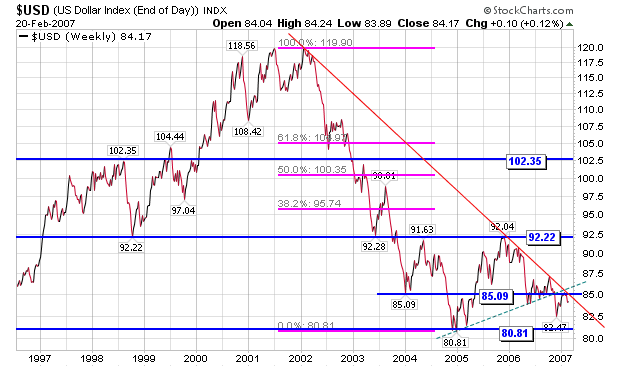
Weekly 10 year view of the same. Note the attempts to break the red downtrend line have failed on each attempt. It doesn't look like a bottom is in according to this chart.
Here is a 3 year daily view. Note the downtrend channels in red and purple. Until the dollar breaks above these channels the trend is down.
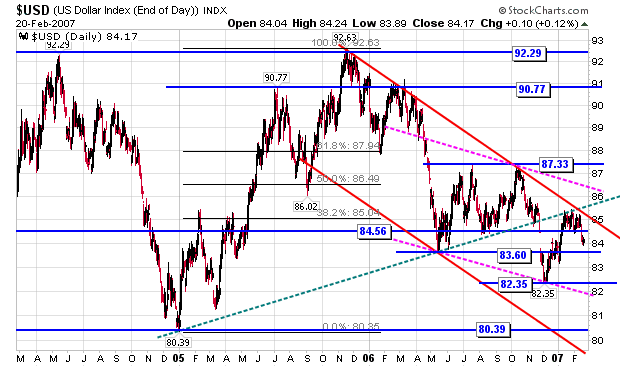
2 year daily view of the same. In this example I have drawn a descending wedge. A breakout of the wedge is a bullish sign but it does not appear the USD has the strength to do so. Note the bottom of the wedge is descending towards tha last support level. A break of 83.60 and 82.35 will take us down to test the lows of 81.28 and the bottom of the wedge.

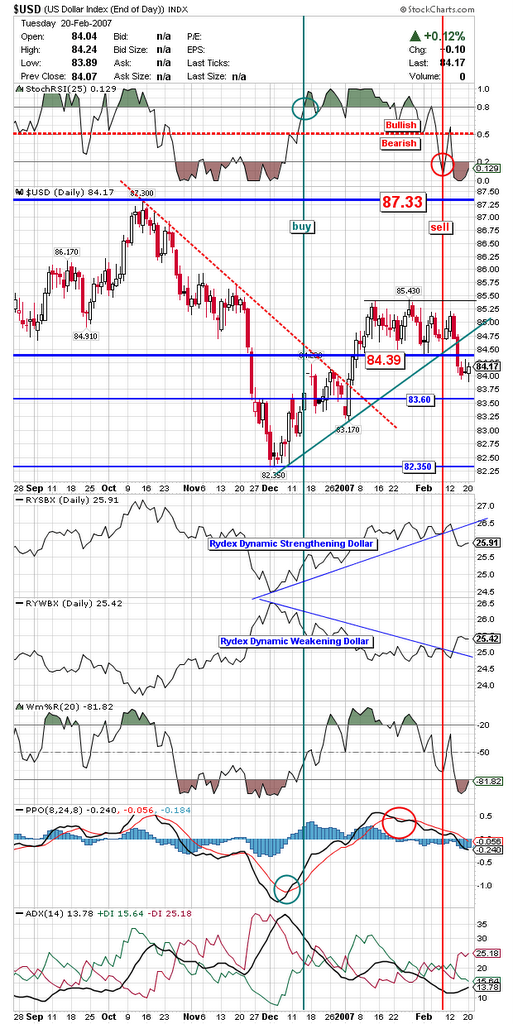
6 month daily chart. Note the range 85.43 to 84.39 has been broken to the downside. This is bearish and confirms the downtrend has begun following the consolidation period.
A breakout above this consolidation level (ie. above 85.43) would be needed to change the trend upwards.
posted by Emirates Capital Asset Management @ 11:46 AM
0 Comments
![]()
![]()

0 Comments:
Post a Comment
Subscribe to Post Comments [Atom]
<< Home