Stock Market Update 07 January 2013
From my previous update 30 Dec 2012:
I expect there will be some watered down solution to the "fiscal cliff" and we will get a rise in the markets as a result. The key will be to see if they can overcome key resistance and hit new highs for this cyclical bull market or pull back into the upcoming bear market.
A huge up-week in the markets (+3.55% on ACWI; our proxy ETF for the Emirates Group Provident Scheme equity funds) as I expected due to the partial resolution of the "fiscal cliff". For the most part the "solution" was to postpone the major decisions on spending cuts by 2-3 months as well as extend the "debt ceiling" to the same dates. This allows an opportunity for at least a month of market rises before the next uncertainty begins once again. What a circus!
My views remain unchanged from my previous post. We are still in a cyclical bull market confined within a secular bear market. Markets are not cheap; in fact now they are short term overbought and due for a pullback. There is a real danger this cyclical bull ends sometime this spring so it is unwise to have overweight exposure to equities given the backdrop of the next round of "negotiations" in Washington starting in probably mid-Feb. However, it is impossible to "call the top" so the best strategy is to stay with the trend until it changes.
CLICK ON ALL CHARTS TO ENLARGE
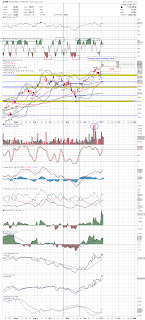
ACWI daily chart:
A very encouraging start to 2012. Markets had a nice up-move on Dec 31 followed by a "gap up" advance on Jan 02 following the "fiscal cliff" settlement. For the remainder of the week price held the level achieved on Jan 02.
The gap up in price exceeded the upper Bollinger Band and has held for 3 days. As such, the markets are currently short term overbought and either a pullback or a consolidation at current levels is expected. In addition, gaps often act as a magnet and usually are "filled" before the next advance can occur. Given such, this is further evidence a pullback from current levels (at least to fill the gap as indicated by the red box) is expected. Once the backfill occurs it will be important to note whether price resumes its uptrend or the "gap fill" becomes part of a broader sell-off.
The short term charts are bullish but overbought.
ACWI daily chart (Dec 2011-Feb 2012)
It is interesting to note last year at this same time we had a similar "gap and go" occur. Note price gapped up and then in the next few trading sessions the gap was filled before the price advance began once again.
I expect something similar this time.
ACWI weekly chart
The weekly chart remains bullish with a significant breakout of the resistance zone @ 47.23-48.38 taken out last week. As such, this level now should act as support on any weekly pullbacks.
Ideally price will correct its current short term daily overbought condition with a pullback followed by a weekly close above this support level. Should it do so it would be a very bullish sign we are heading higher from here.
The weekly chart remains bullish.
Ideally price will correct its current short term daily overbought condition with a pullback followed by a weekly close above this support level. Should it do so it would be a very bullish sign we are heading higher from here.
The weekly chart remains bullish.
ACWI monthly chart
Key monthly resistance at 48.38-48.67 has currently been exceeded but it would take a monthly close at the end of Jan 2013 to confirm the move.
The monthly chart remains bullish.
Bottom Line:
So far it has been a good start to 2013 associated with the "relief rally" as a result of the fiscal cliff being partially resolved. Having said that, expect more problems to transpire in early Feb 2013 associated with the spending cuts and debt ceiling (which have yet to be resolved and merely pushed back for a few months).
In the next week earnings will be reported. The January reports yearly are important because most companies will give forward guidance not only for the next quarter but the year as a whole. If the overall theme is "positive", my expectation is a rising over-bought equity market into the spring followed by a decline associated with downgrades once the 1st quarter 2013 earnings are announced. Should the 2013 guidance be "negative" I would expect a sell off into Feb-Mar followed by a gradually rising market into the summer.
My asset allocation model remains unchanged at a 45% equity/55% bond/cash weighting. Those who are heavily overweight equities may want to consider taking some profits near these levels until the fiscal cliff and forward earning guidance are sorted out.
As of today I remain in a 50% Equity/50% USD Cash position as I indicated in my last post:
-Russell Global 90 Fund: 40%
-Fidelity International Fund: 10%
-Russell USD Liquidity II Fund: 50%
Legal Disclaimer:
The content on this site is provided without any warranty, express or implied. All opinions expressed on this site are those of the author and may contain errors or omissions. NO MATERIAL HERE CONSTITUTES "INVESTMENT ADVICE" NOR IS IT A RECOMMENDATION TO BUY OR SELL ANY FINANCIAL INSTRUMENT, INCLUDING BUT NOT LIMITED TO STOCKS, OPTIONS, BONDS OR FUTURES.
The author will reveal his current market positions and holdings but actions you undertake as a consequence of any analysis, opinion or advertisement on this site are your sole responsibility.
For further information please use the following email address and I will do my best to get back to you when able.
ecamquestions@gmail.com


