Switched to 100% cash
Fidelity EK Managed Eq. Port: 15.74 (08 Jun)
MLIM EK Managed Eq. Port: 14.70 (08 Jun)
As of Thursday, 08 June the charts have turned fully bearish. As such, I have switched my portfolio to 100% cash (went to 50% cash 17 May).
My current cash mix is 50% USD, 25% Euro and 25% Australian dollar (essentially hedged cash-neutral as the markets are giving mixed currency signals at present).
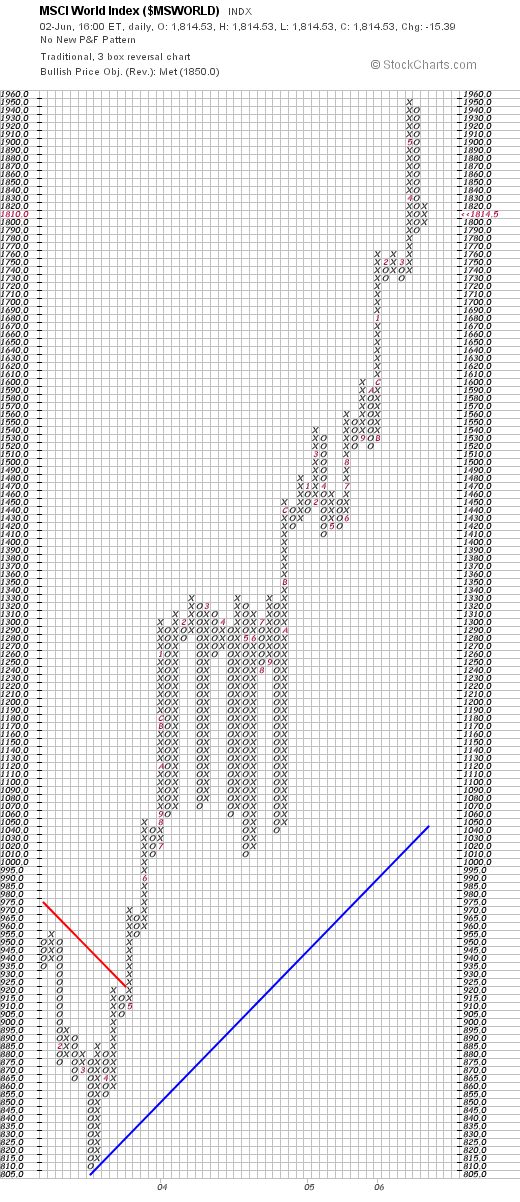
First chart is the Dow Jones World PNF chart I use (click chart to enlarge):

As can be seen, the price has broken below the 241-244 level I spoke about previous and there is very little support all the way down to the blue support line at around 183. It doesn't necessarily mean it will get that low but it is possible.
Second chart is the MSCI PNF chart:
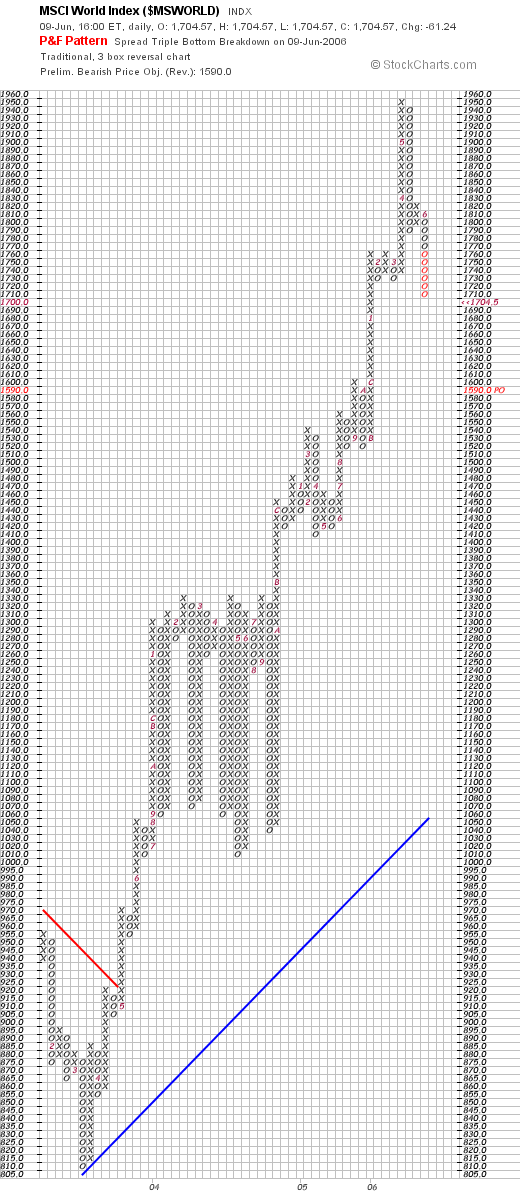
This chart also generated a sell signal when it broke below 1790. There is very little price support until 1320.
A different view is the same index in a weekly line chart for the past 5 years:
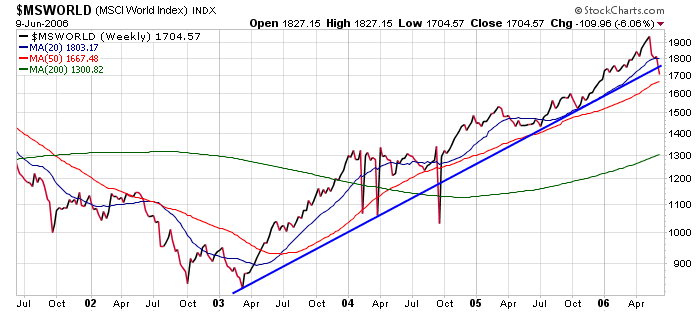
As can be seen, price has broken below the uptrend line in place since the bottom in early 2003 (the quick drop and reversal in late Sept, 2004 was very short lived and thus ignored). As can be seen, price has dropped below the 20 week moving average. Next line of support would be the 50 week moving average (1667) and through that the 200 week moving average (1300; very close to the PNF support mentioned previous at 1320).
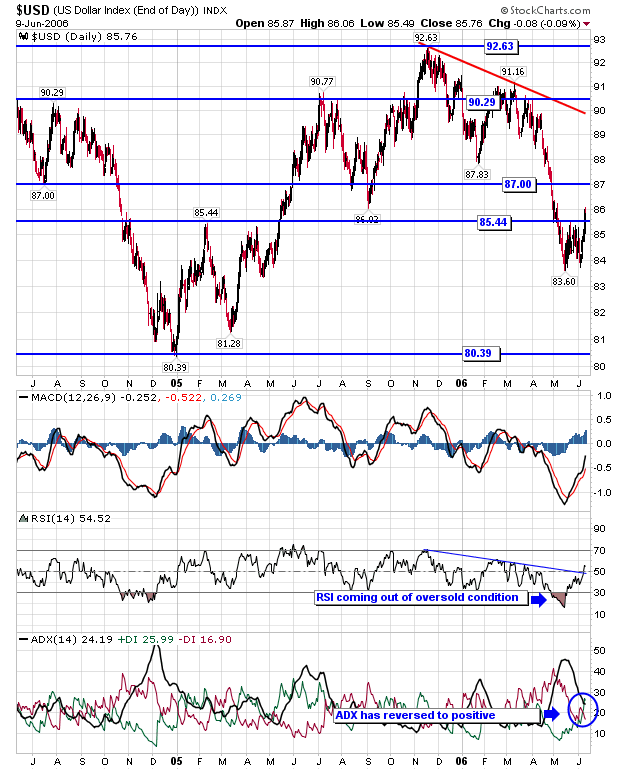
Why switch into the USD? Here is why:

A bottom appears to have been formed in the 83.60-83.80 area and a buy signal initiated through 85.30. Once again we see there is very little resistance on this chart until the red downtrend line at around 88.20. Also the chart projects a theoretical price objective of 90.50.
What would turn me bearish on the USD would be a reversal that takes out the bottom just discussed at 83.60. If this happens there will be a rush to the Euro as the next line of support would be at 80.39:
Bottom line: 100% in cash and expect to be there until October. While I do expect there will be some sort of bounce over the next few months, I think there is the potential for much more downside over the next 4 months. On the plus side, I do expect once October is here it will be potentially one of the best buying opportunities in years.
posted by Emirates Capital Asset Management @ 8:26 AM
0 Comments
![]()
![]()


