Wednesday, February 28, 2007

Stock Update 28 February 2007

A very quick update to those who are wondering what the he## went on yesterday.

Huge correction in the Chinese market (long overdue) combined with weak US Durable goods orders (ie big ticket items such as airplanes, cars, appliances, etc) led to this decline.

This could be the buying opportunity I was looking for to get fully long; it could be the selling opportunity I am looking for to go to cash. Bottom line is the correction I warned about has begun (either a blip or the start of a bear market has yet to be determined).

The markets were too frothy and the correction I warned about has occurred (ironically the day before the annual Emirates Group provident fund meeting that unfortunately I am unable to attend this year).

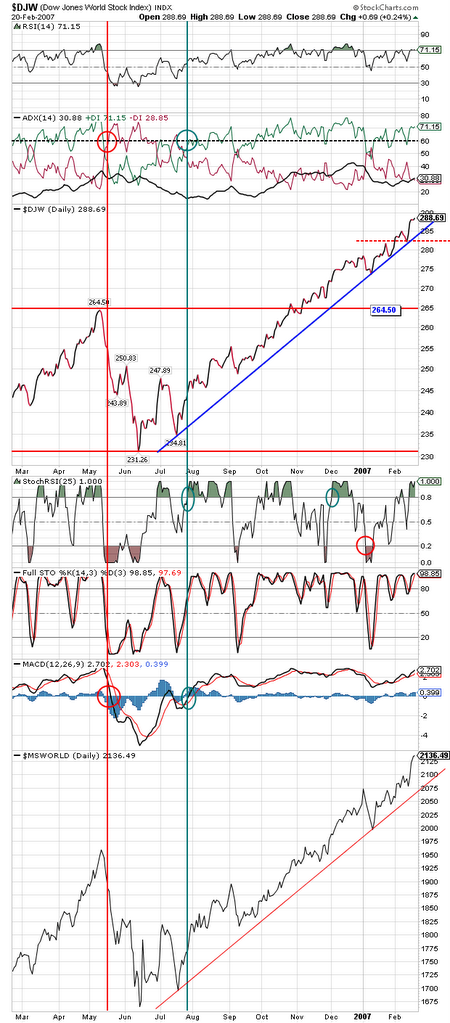
Next.......what now? Here is the 1 box PNF I use to give me an indication of market direction (click to enlarge):


Bottom line: no change in position as of today. Holding 50% equities/50% cash position and looking to either go fully long (ie. a 100% equity position) or sell to cash.

Here is how I will play this:

-A daily close close below 274 and I will go to cash (currency yet to be determined if/when this occurs).

-A price reversal upwards that indicates a new buy signal will result in me going 100% long (ie. fully invested in equities).

I have no idea which way it might go....will advise when I have made my move.

Wednesday, February 21, 2007

Currencies update 21 February 2007

Various currency pairings (click on charts to enlarge):

EURO:USD

Currently long euro vs usd on a short term basis.


Currently long EURO vs USD on a medium term basis.


UK Pound:USD

Currently long USD vs pound on a short term basis. Very close to a change of trend to long pound. Must hold above 2.257 resistance level.


Long USD vs Pound on medium term basis. However showing signs of strength and may switch to long Pound as long as the uptrend line and red support line is not breached.


Aussie Dollar:USD

Long Aussie dollar vs. USD on a short term basis. Aussie dollar is looking quite strong with a breakout of the symmetrical triangle.


Currently long USD vs. Aussie dollar on a medium term basis. However the uptrend channel is well defined so this might be a good buy opportunity in the Aussie. I expect the Aussie to turn bullish soon.

U.S. Dollar Update 21 February 2007

"Top Down" view of the U.S. Dollar (click chart to enlarge).

First is the long range view with a 20 year monthly chart. No surprises here and it is very easy to see which direction it is going (DOWN).

Very interesting to note the decline that occurred from 1985-1988 resulted in 1 swift move down(3 years) followed by 3 attempted recoveries (each with lower highs and lower lows) that stayed in a fairly narrow trading range over the next 8 years (1988-1995). Also note the "recovery" when it finally occurred retraced only 50% of the down move (this is known as a Fibonacci retracement level).

Assuming history repeats itself, is it possible the USD has done it's 3 year swift down move once again (2002-2004). If so it is possible we will see 3 attempts at recovery (each with lower highs and lower lows) and not see a recovery of any sort until 2012 (8 years)! Also when this "recovery" occurs, it is possible it will not achieve any more than the last recovery (50% of the retracement) which is 100.51. Not a compelling story for the USD.


Weekly 10 year view of the same. Note the attempts to break the red downtrend line have failed on each attempt. It doesn't look like a bottom is in according to this chart.


Here is a 3 year daily view. Note the downtrend channels in red and purple. Until the dollar breaks above these channels the trend is down.


2 year daily view of the same. In this example I have drawn a descending wedge. A breakout of the wedge is a bullish sign but it does not appear the USD has the strength to do so. Note the bottom of the wedge is descending towards tha last support level. A break of 83.60 and 82.35 will take us down to test the lows of 81.28 and the bottom of the wedge.


6 month daily chart. Note the range 85.43 to 84.39 has been broken to the downside. This is bearish and confirms the downtrend has begun following the consolidation period.

A breakout above this consolidation level (ie. above 85.43) would be needed to change the trend upwards.

Stock Update 21 February 2007

No change in position, still 50% long equities and 50% cash (Euro's) in the A/B account.

The world's stock markets have shown unbelievable strength over the past 6 months due to the incredible amount of liquidity being produced by central banks around the world. Since the Dow Jones World index PNF chart gave a buy signal on 04 Aug 2006 through 247 the market has risen 16.9% (click on charts to enlarge them). This rate of appreciation is unsustainable and we are due for a correction. Hence my reluctance to switch to a 100% long equities position at this time.


When will the correction occur and how much will it correct? Will it be a minor "correction" and a good time to buy into the market or will it be a top and a good time to liquidate positions.............How long is a piece of string? Unfortunately technical analysis is not a crystal ball and any predictions are really nothing more than guesses.

The point is we will not know the top until it occurs and the correction is underway. At that point I will reassess my position and depending on the nature of the correction (based on the technical indicators) either switch to 100% cash (if it appears a top of significance is in) or go 100% long in equities (if it appears it is merely a correction in the continuation of the bull market). Until then I will hold my present positions.

Your email address:


Powered by FeedBlitz