US. Dollar in Trouble
Over the past 2 trading days the U.S. dollar has been hit with massive selling. As can be seen on the chart below, it has broken through a key support level and is currently sitting right on the next level of support (click chart to view):
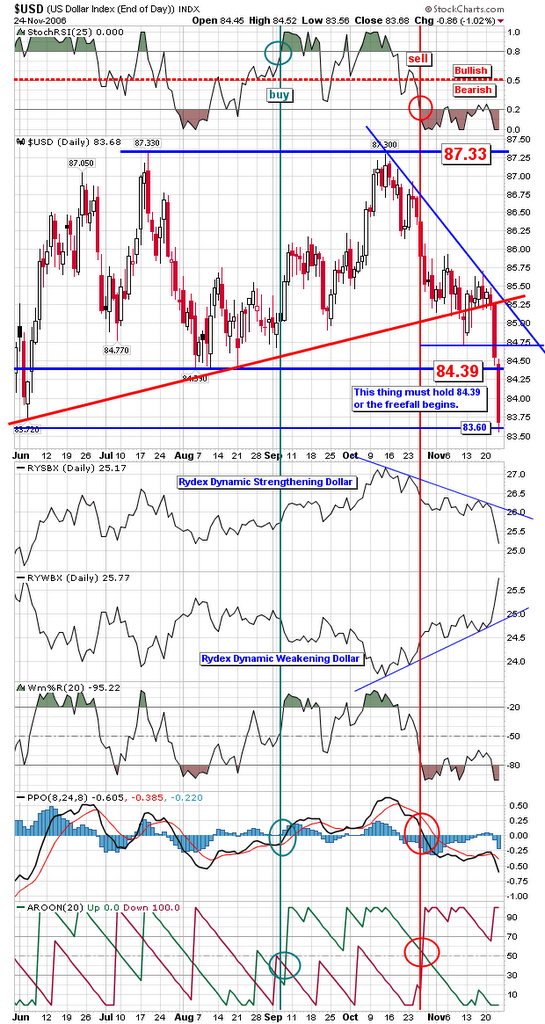
The weekly chart shows that the dollar has broken through a well developed trendline that extends from the Dec/2004 lows to present. The current level of support and the next level are clearly visible (click chart to view):

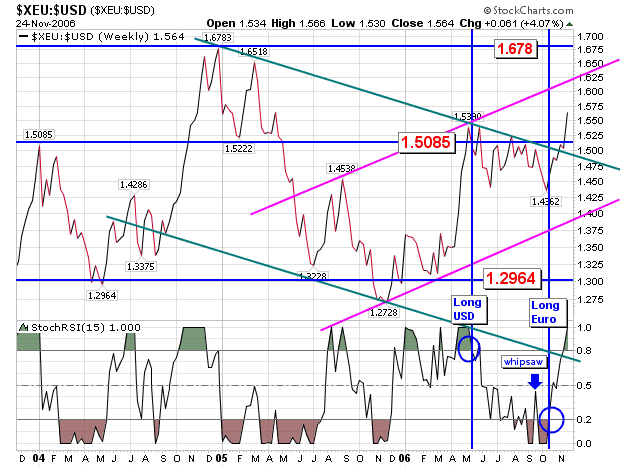
The daily Euro : U.S. dollar ratio chart I use has broken out of a descending price trend channel (shown in pink in this chart). This is Euro bullish/dollar bearish (click chart to view):

This is the same Euro : Dollar ratio chart on a weekly scale. Note over the past few months the "fight" over 2 competing channels; a descending green channel and a rising pink channel. It appears the breakout has negated the green channel and the rising pink channel is dominant. This again is Euro bullish and dollar bearish (click chart to view):
So why the sudden selling in the USD over the past few days? It is important to point out the past 2 trading days were done on while the U.S. markets were either closed (on Thur) or open for limited hours (on Fri). In addition most US traders took the entire long weekend off (Thur-Sun) so the opportunity to for someone to "move the market" was there.
As to fundamental reasons why this might have happened, I have done a cut and paste of what I feel is a good attempt at analyzing what is going on:
A Market Warning:
Our paid subscribers know that the Fed has been accelerating M3 Liquidity at a phenomenal rate. Our Long Term Liquidity chart has shown extremely high liquidity levels which was part of the Fed's strategy to keep businesses in a solid growth pattern. The expectation was that this would spill over into consumer wages and spending and keep the economy away from a recession.
But, there is a danger in printing too much money and floating too much liquidity. The danger is that it drives down the value of the U.S. Dollar. This is not much different than a corporation increasing their shares outstanding and diluting the value of their average share. Fed M3 levels have been accelerated by about 10%, and this dilution has two negatives attached to it.
One, the excessive amounts of M3 are inflationary. The trade off for stimulating the economy is an increase in inflationary pressures. That in turn, puts pressure on the Fed having to keep interest rates up which is negative for the economy.
The other negative, is the effect on the U.S. Dollar. As the value is driven down, the Dollar falls in the currency market and as it gets more serious, other countries will want to sell their Dollars rather than get stuck holding the bag.
That is essentially what is going on this morning. The U.S. Dollar declined to a 19 month low against the Euro and that will fuel inflation. Why would it fuel inflation Because, as our Dollar becomes worth less, it takes more of our hard earned dollars to buy the same imported goods from other countries.
We all know that a tremendous amount of the goods we buy are made in China. We are their biggest buyer of goods and they hold most of their reserves in U.S. Dollars. There is a point where China would be pretty dim-witted to hold on to U.S. Dollar reserves that was were eroding in value. If you owned a stock that continue to fall and lose you money, you would sell it, and it is now getting to the point that it would be prudent for China to sell their U.S. Reserves. That would drive the Dollar down further and create an investor crisis in the Dollar and U.S. Stocks.
Bernanke's strategy has looked good so far, but his strategy to inflate M3 levels in an effort to avert an inverted yield curve and ward off an recession is "no free lunch". In the end, you end up paying somehow, or sometime.
The markets will be looking very carefully at the retail sales today. It is expected to be the biggest revenue day of the season and a predictor of what the Christmas season spending will be like. The consensus is that it will be very good, which would also be very good for the stock market. But, any good news about our consumer buying levels could easily be trampled on by foreign investors wanting to sell the U.S. Dollar and U.S. stocks.
I am sure that the Fed and the Government will be intervening in the currency markets today and that will likely create a lot of volatility. It will also raise the level of risk in the market, so go to www.bloomberg.com and other sites and keep an eye on what is happening in the foreign stock markets as well as our own.
On Tuesday, we told our paid subscribers that it was time for Bernanke to stop accelerating M3 levels. This morning, the currency market and a foreign countries are saying the same thing to Bernanke ... Stop accelerating M3 or we are going to sell the U.S. dollar and equities.
Regards,
Marty Chenard
StockTiming.com
I think this analysis goes somewhat towards what is happening but does not tell the whole picture.
From the stock bubble burst of 2000 the Fed brought interest rates down to a low of 1% in June 2003. This was done in order to save the U.S. economy from a severe recession. The problem is recessions are "good" in that they relieve all the excess pressures in an economy. They are like a reset button on a computer and once the "reboot" is complete the computer runs better as there are not assorted needless programs running to slow it's performance.
The problem is the U.S. did not allow that recession to run it's course. They instead decided to "financial engineer" a premature recovery by lowering interest rates to well below the rate of inflation and cranking up the printing presses to print money (also known in economic terms as the M3 money supply). This created excessive amounts of liquidity in the market (tons and tons of money looking for a place to go). While they might have thought this was appropriate, instead of eliminating the bubble it merely transferred it into another area; the real estate market. It is this bubble they are now trying to eliminate.
They have now brought up the Fed funds rate to the current 5 .25%. In doing so they have started to let the air out of the real estate bubble. Also the higher rates have been somewhat dollar positive to this point (but I am sure much less dollar positive than Bernanke would have liked).
What is happening is the Bernanke knows he has been cornered. He needs to keep rates high in order to deflate the U.S. real estate bubble. This is now happening and I think if that was all he had to worry about he would now be cutting rates dramatically as there is growing evidence the housing market is on the verge of going into freefall. If this happens consumers stop spending and the U.S. goes into recession. He wants to avoid this.
The problem is he also needs to think about the U.S. dollar. He has increased interest rates by 425% over the past 3 years yet the dollar has shown little strength:

He needs to keep the dollar relatively strong in order to attract foreign investment in the U.S. (treasuries and stock investments from abroad). If the markets are strong but the underlying currency is weak then foreign capital will go where there are strong markets and a strong currency (Eurozone, maybe Japan next year should the yen start to appreciate). As such, he would like both a strong market and a relatively strong USD.
The problem is he can't get both given the current situation. So does Bernanke defend the dollar or defend the home market? Tough call as he can't do both (however if push comes to shove there is no doubt he will defend the market and allow the USD to fall). However he can "appear" to be doing both as follows:
-keep interest rates relatively high to attract foreign capital while deflating the housing bubble, and
-continue to pump money into the economy (M3) to keep the economy from going into recession.
I think of this strategy using the following analogy. You have one Fed official pumping gasoline on a fire through a hose from one side to keep the fire buying (by printing money) and at the same time the Fed is hosing down the fire with water to keep it from getting out of control (via setting the Fed funds rate at a moderate level and attempting to "talk down" the market by claiming they are "tough on inflation", "constantly vigilant for signs of inflation" while Henry Paulson continues to talk about the "strong dollar policy" blah, blah, blah).
If they get this balancing act right (and believe me; just about everything you hear from either the Fed or the Treasury secretary is just that; "acting") they might just deflate the housing bubble while keeping the U.S. out of recession. The "fire" keeps buying at a constant pace and everything appears to be in equilibrium. However, too much "water" and the fire goes out and the U.S. goes into recession; too much gasoline and the fire gets out of control and inflation skyrockets. The rest of the world needs to buy into their "act" that they can manage this. However, should this get out of control you could see a run on the USD.
I will be watching the currency markets very closely over the next 2 days. Should the current level of support not hold there is a danger this could turn into a much larger run on the USD. If support is broken I will be moving 100% into NON-USD cash.....probably 100% Euro. Will advise if/when this occurs.
posted by Emirates Capital Asset Management @ 7:18 AM
0 Comments
![]()
![]()